
Venn Diagram in detail
It was in a reading, at the rock shop, I think, at least, that’s where my first note was from, and I had this great illustration.
Imagine, if you will, a typical Venn Diagram, two circles, with an overlapping section. What this shows? The relationship between what is in one set of data with the other set, and where the two intersect, overlap, or interact in one form or another.
There’s a whole host of material available and quick web search went awry, too quickly, and then I’m stuck with possible and probable bits, and nothing makes too much sense. Pause. A typical Venn diagram is two circles with an inserting set of material that cohabitates in both spheres. There are common, useful, and meme-friendly ways to show where disparate data points can combine.
Venn Diagram in detail
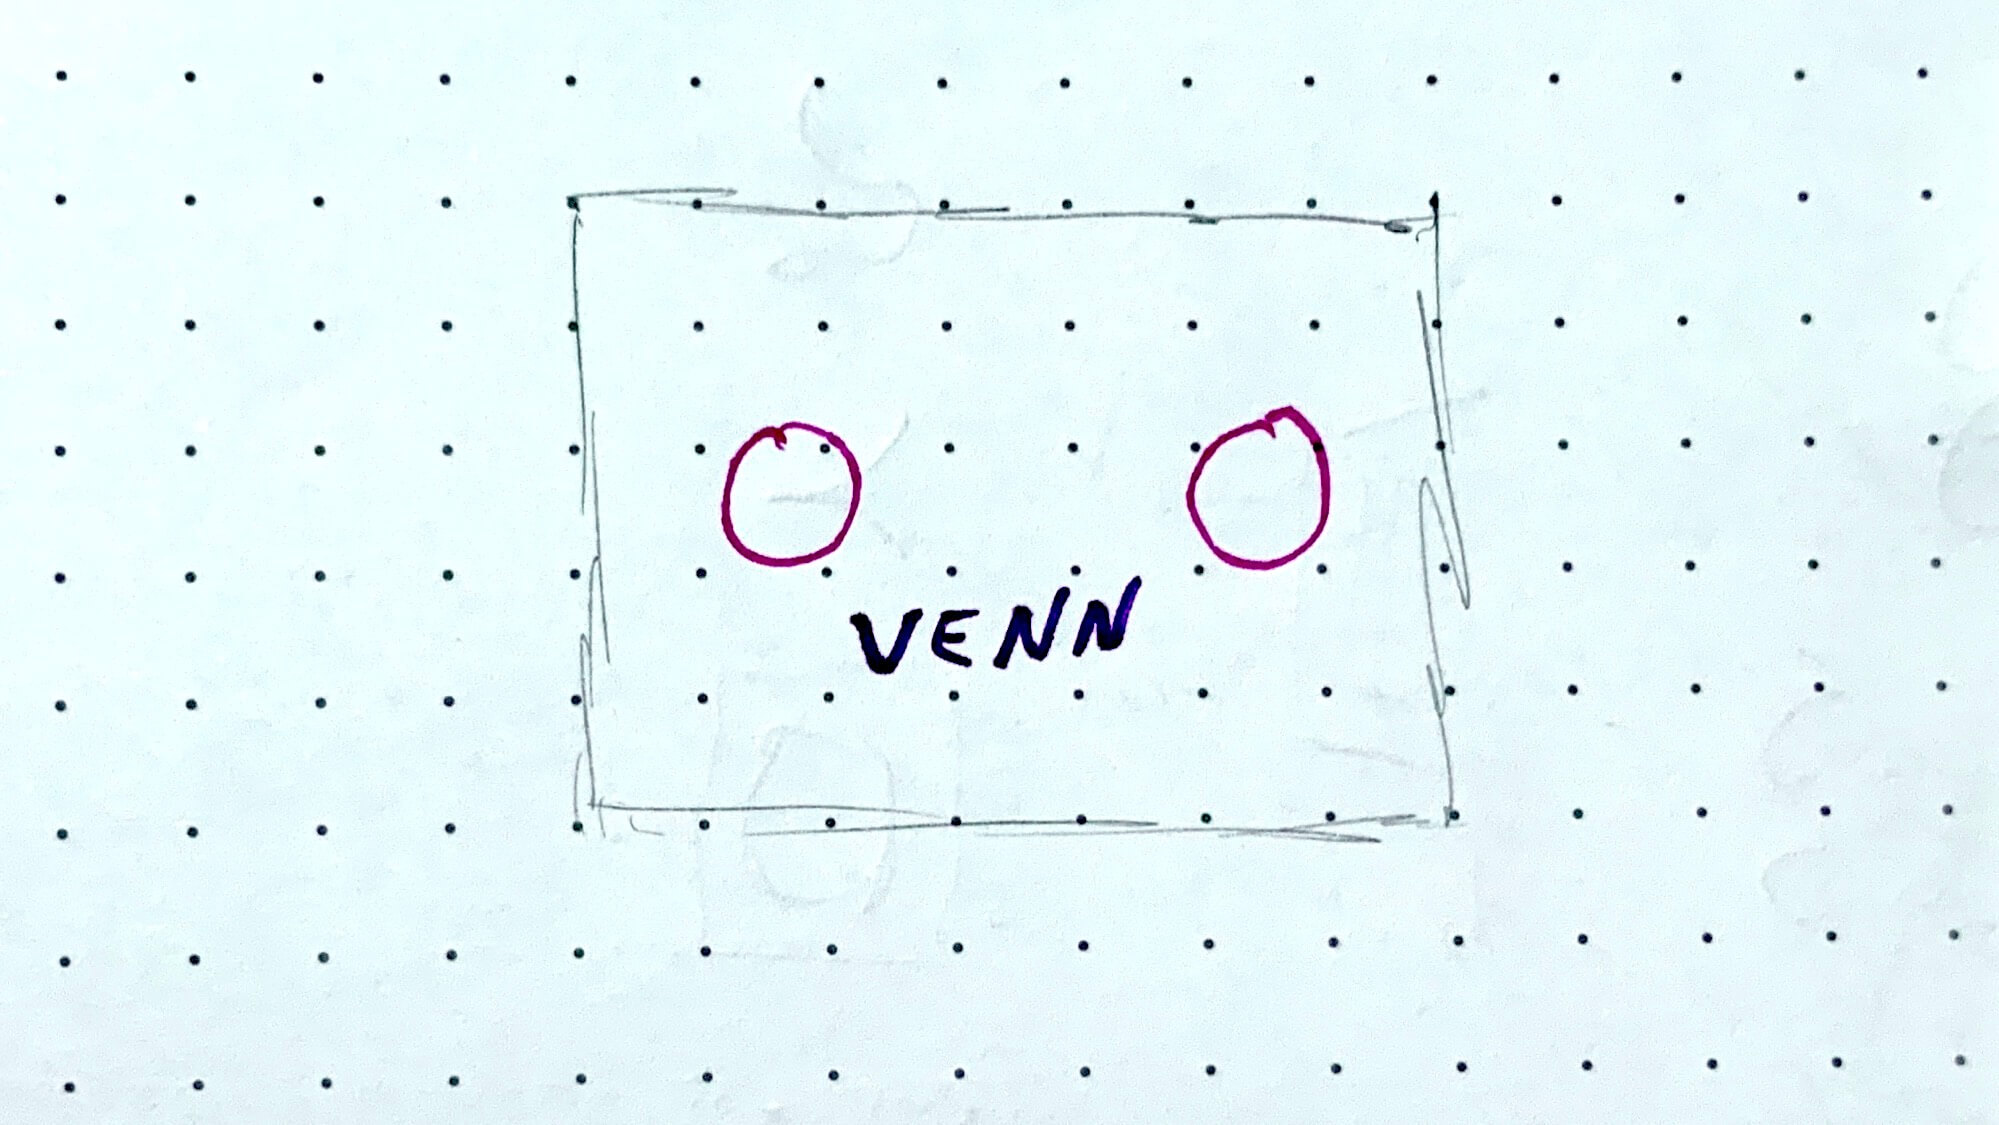
In the example, though, in the reading, I was trying to suggest that there are two sets of data, and both sets don’t exist in any way within the realm of each other.“Imagine, if you will a typical Venn diagram, two circles, only, those two circles don’t touch each other.”
Venn Diagram in detail
Venn Diagram
Venn Diagram in detail
It explains, in painful detail, the way the planets are, and what is going on, and what is happening, there are two sets of data that we normally compare with each other, but for now?
Imagine, if you will a Venn Diagram with two circles, only, those circles are very far apart.”
Makes sense, doesn’t it?
I mean, generally gesturing around, see?